
What if a full appointment book is masking your barbershop’s biggest opportunity? A packed Saturday can look like success, but it won’t tell you whether clients are returning, chairs are being used consistently, or each visit is supporting healthy revenue. A barbershop performance dashboard brings those signals into view when you focus on the right measures and interpret them together.
If booking, client, sales, and inventory information lives in separate places, it’s easy to miss patterns or react to a single number without context. You don’t need to track everything. You need a focused set of indicators that answers practical questions about your shop. Connected tools for booking, client management, transactions, and inventory can give you a broader view of daily operations.
This guide covers which revenue, client, and operational metrics deserve attention, how to interpret changes against your shop’s schedule and goals, and how to turn what you learn into practical next steps. You’ll also find a repeatable review routine to make performance data useful in everyday decisions, not just another report to glance at.
Key Takeaways
- Build a barbershop performance dashboard around decisions you need to make, not numbers that look impressive but offer no clear next step.
- Organize measures across revenue, appointments, client relationships, and inventory to spot where closer attention may help.
- Read results against comparable periods and changes in your schedule or service mix before deciding what they mean.
- Use a steady review routine to turn patterns into a small number of practical actions and follow up on what changes.
- Connect booking, client records, sales, and inventory tools to create a clearer view of daily operations.
What a Barbershop Performance Dashboard Should Help You See
Bookings may sit in one place, sales in another, and client or inventory details somewhere else. When you’re piecing together the shop’s performance between appointments, scattered figures can be frustrating. A barbershop performance dashboard is a focused view of selected business measures that helps you understand what’s happening and decide what to do next. It’s not a wall of numbers. It’s a way to connect daily activity to decisions you can influence.
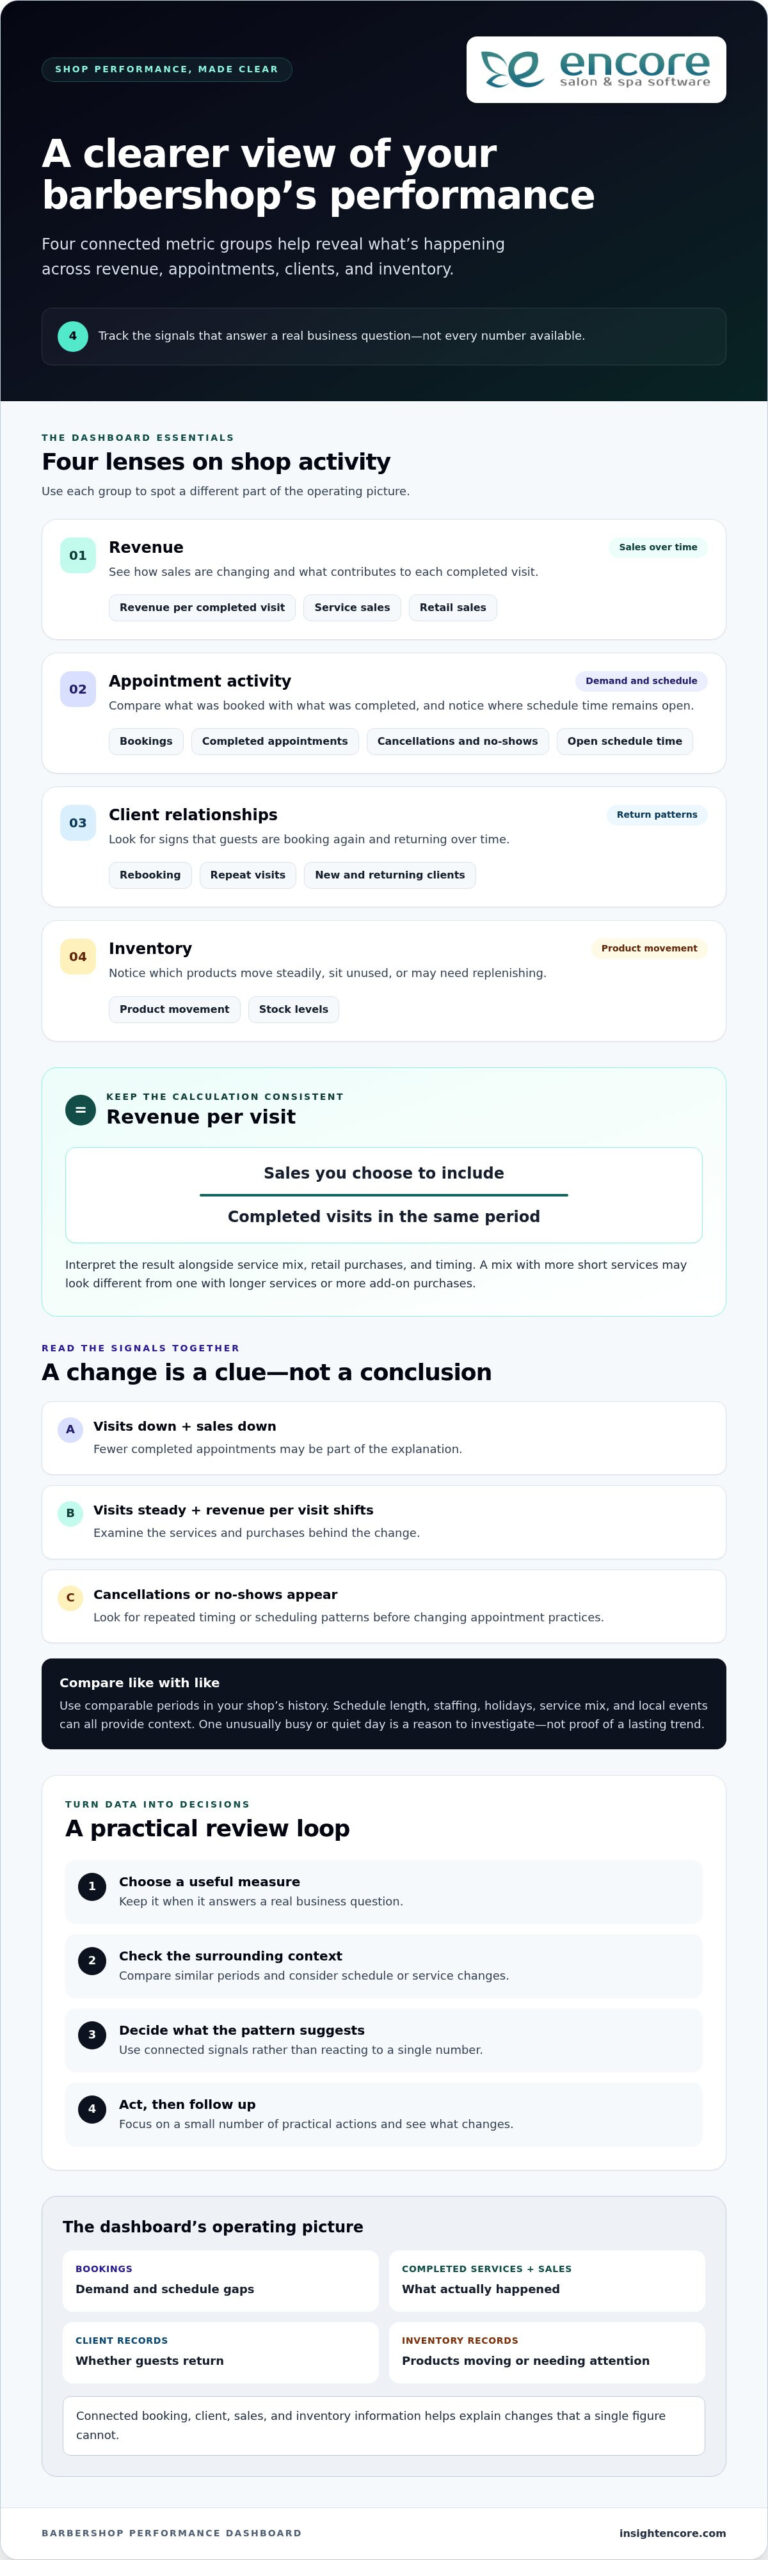
Think of a dashboard as the shop’s operating picture. Booking records can show demand and gaps in the schedule. Completed services and sales transactions show what actually happened, while client records can reveal whether guests are returning. Inventory records add context by showing which products are moving and which may need attention. Together, these sources can help explain a change that a single figure can’t.
The goal is to track useful signals, not every available count. A large social following or a high number of appointments booked might look impressive, but neither tells you whether those bookings are completed or clients come back. Give a measure space on your dashboard when it answers a real business question and points toward an action.
Which daily questions should the dashboard answer?
Start with questions that connect shop activity to choices you can make. For demand, ask whether upcoming bookings are filling the hours and days you want to staff. If certain periods are consistently quiet, you might adjust scheduling or consider a targeted promotion. For completed services, compare appointments on the book with visits completed. A gap may prompt you to review cancellations, reminders, or the time set aside between services.
For sales activity, look at what guests purchased alongside their services. If service sales are steady but retail activity changes, explore product visibility or staff recommendations before changing your inventory. For returning clients, review whether guests book their next visit or come back over time. That pattern can help you decide where follow-up or rebooking conversations deserve more attention.
Keep the time frame in mind. One unusually busy day may reflect a holiday, a local event, or a schedule change. One quiet day may be just that, one day. Treat it as context to investigate, not proof of a lasting trend. Look for a pattern across comparable periods before making a bigger change.
Dashboard, report, and KPI: what is the difference?
A report gives you detailed records to examine, such as individual transactions or appointment histories. A dashboard presents a concise overview of selected measures, making it easier to notice what deserves a closer look. A business dashboard can be organized in different ways, but its purpose is to make important information easier to monitor and use.
A KPI, or key performance indicator, is a measure tied to an important business objective, such as improving repeat visits. A raw operational count records activity; a KPI shows whether that activity is helping meet a goal. A count tells you what happened; a KPI helps you judge whether it moved the business toward an objective. That distinction keeps your dashboard focused on decisions, not just data.
Which Barbershop Performance Metrics Belong on Your Dashboard?
A useful barbershop performance dashboard gives you a balanced view, not a crowded collection of numbers. Choose a small group of measures across revenue, appointment activity, client relationships, and inventory. For each one, know what question it answers and what decision it might inform. A metric without a clear purpose adds noise instead of helping you manage the shop.
- Revenue: Track sales over time, revenue per completed visit, and the mix of service and retail sales.
- Appointment activity: Review bookings, completed appointments, cancellations, no-shows, and open time in the schedule.
- Client relationships: Watch rebooking and repeat-visit patterns, including how new and returning clients contribute to activity.
- Inventory: Look at product movement and stock levels to notice items that sell steadily, sit unused, or may need replenishing.
Revenue and appointment indicators to interpret together
Revenue per visit can show whether the value generated by each completed appointment is changing. Calculate it consistently by dividing the sales you choose to include by completed visits for the same period. Then interpret the result alongside service mix, retail purchases, and timing. A period with more short services may produce a different average than one with longer services or more add-on purchases. Keep the calculation consistent so comparisons remain meaningful.
Pair the revenue figure with appointment activity. If completed visits fall and sales fall with them, fewer appointments may be part of the explanation. If visits stay steady but revenue per visit shifts, examine the services and purchases behind the change. Compare similar days or periods in your own shop’s history rather than applying a universal target. Schedule length, staffing, holidays, and changes in the services offered can all affect the result.
Cancellation patterns need the same care. Review cancellations and no-shows in relation to bookings, and look for repeated timing or scheduling patterns before changing policies or appointment practices. One cancellation is an event; a recurring pattern is a reason to investigate.
Client and inventory signals that reveal patterns
Rebooking and repeat visits help you understand whether clients are returning and how consistently they do so. A change may relate to service timing, availability, or the way the next appointment is offered. Use client records to explore the pattern, then choose a practical response, such as making rebooking part of checkout conversations. Keep staff utilization distinct from shop-wide appointment measures: the former focuses on an individual barber’s working time, while the latter looks across the shop’s schedule and capacity. For a closer look at the staff measure, see this barbershop staff utilization guide.
Inventory movement adds context to sales. If a product’s sales change, consider whether client demand shifted, purchasing changed, or the item was unavailable when guests wanted it. Compare sales activity with inventory records before adjusting orders. No single measure explains the whole story. Together, these signals help you decide what deserves a closer look and what action is worth testing.
How to Read Dashboard Results Without Misleading Yourself
A dashboard shows what changed, but it can’t explain the cause on its own. Read each measure in context before adjusting prices, staffing, or promotions. Upcoming bookings are a leading indicator: they offer a view of demand that may turn into future work. Completed appointments and sales are lagging results: they show what has already happened. Comparing the two can help you see whether a shift in bookings is showing up in completed business, but allow enough time for the results to develop.
Compare like with like before drawing conclusions
Choose comparable periods, such as the same weekdays across two time windows, rather than comparing a full week with a partial one. Check whether opening hours, staffing, available services, or local events changed. A holiday week may follow a different pattern from a regular week, and a new service mix can shift average sales without indicating a problem. Be cautious with small samples. A single comparison can point to a question, but it rarely proves what caused the change.
Turn a metric change into a useful question
Suppose completed sales are lower than in the prior comparison period. The cause could be fewer appointments, more cancellations, shorter hours, a different mix of services, or a change in retail purchases. Each explanation suggests a different follow-up. Check booking records, completed appointments, and transaction details before deciding whether to change a schedule, price, or promotion.
A metric is a clue to investigate, not a diagnosis of what’s wrong. Use a change to guide your next question, then look for supporting evidence. Connected booking, client, point-of-sale, and inventory records make that review more grounded. Encore’s software features include tools across these operational areas, helping shops keep relevant information connected to daily work.
| Signal | Possible explanations | Follow-up question |
|---|---|---|
| Upcoming bookings are down | Fewer repeat bookings, reduced availability, seasonal demand, or a shorter booking window | Are comparable days and booking lead times also lower? |
| Completed visits are steady, but sales have shifted | Different service mix, changes in add-on purchases, or altered transaction patterns | Which services or items account for the change? |
| Cancellations have increased | A particular day, time, service, or booking pattern may be contributing | Do appointment records show a recurring pattern or just a brief fluctuation? |
| Product sales have changed | Shifting guest demand, purchase timing, or product availability | Do inventory records support the same pattern? |
For a barbershop performance dashboard to support sound decisions, keep the comparison method consistent and note important changes alongside the figures. If the signal persists and related records point in the same direction, you have a stronger basis for action. If they don’t, keep observing rather than making a costly change based on one reading.
Build a Simple Barbershop Dashboard Review Routine
A barbershop performance dashboard becomes useful when you review it consistently and connect what you see to a next step. Keep the process light enough to fit around the work of running the shop. You don’t need a long meeting or a complicated scorecard. A focused check-in, consistent definitions, and a clear record of follow-up can turn scattered figures into a routine you can maintain.
Start with a small, decision-focused scorecard
Choose measures that match your current priorities, such as filling appointment gaps, understanding repeat visits, or reviewing retail movement. For every measure, write down its definition, where its information comes from, and the period you’ll review. This prevents the same label from being calculated differently each time. Add one sentence about the decision it supports, such as, “This measure helps us decide whether to adjust coverage during quiet appointment periods.”
Then follow a repeatable sequence:
- Choose the question. Name the operating issue you want to understand before opening the figures.
- Select the measures. Use only the indicators that help answer that question, and keep their definitions consistent.
- Review the pattern. Compare the chosen period with a relevant prior period, noting changes in hours, staffing, or services.
- Record an action. Decide whether to investigate further, try a practical adjustment, or keep watching the trend.
Move from review to action and follow-up
Close each review with a brief note: what you observed, what you’ll do next, who owns the action, and when you’ll revisit it. For example, if appointment gaps appear repeatedly during a particular time, review staffing coverage or booking availability. Assign one person to follow through, even if that person is the owner. Clear responsibility helps turn a useful observation into a completed task.
Pick a cadence that fits your operating rhythm. A short weekly check can help you notice near-term changes in bookings or cancellations, while a monthly review gives you more room to assess repeat visits, sales patterns, and inventory movement. These are starting points, not fixed rules. If a measure changes slowly, review it over a longer period; if it affects daily scheduling, a more frequent glance may make sense.
At the next check-in, ask whether the action changed the pattern you were watching. If it did, decide whether to continue or make the adjustment part of normal operations. If it didn’t, revisit your assumption before repeating the same step. Avoid adding another metric simply because it’s available. Add one only when it answers a real operating question or helps you make a decision with more confidence.
Use Barbershop Management Software to Connect the Operating Picture
A useful review depends on having relevant operating information available when you need it. If appointments, client details, sales, and inventory are recorded in separate places, it can take extra effort to understand how one part of the shop relates to another. Barbershop management software can bring these everyday activities into one platform, giving you a more organized foundation for reviewing how the business is operating.
Connect everyday records to better-informed decisions
Booking records help you examine appointment activity, such as how the schedule fills and which periods have open time. Client management records add context about guest history and return visits. Consider them together: booking activity shows what’s planned, while client records can help you understand who is coming back and how often.
Point-of-sale transactions provide a record of completed sales. Inventory records add information about product movement. Looking at both can help you ask useful questions: Did product sales change along with inventory movement? Are there items that appear to be moving differently than expected? The records don’t make the decision for you, but they give you relevant details to investigate before changing purchasing or sales practices.
These connections matter when you’re reviewing a barbershop performance dashboard. Encore’s barber shop software brings together tools for online booking, client management, point-of-sale transactions, and inventory tracking. Having these management activities in one platform helps organize information you can use to review daily operations and investigate performance changes.
Choose tools that fit the way your barbershop operates
Start with the work your shop needs to manage. Consider how you handle booking, client information, transactions, and inventory today. Then assess whether a software platform supports those workflows and makes the information easier to keep organized and review. Bringing relevant management activities together can reduce the need to piece together the operating picture from unrelated records.
The right setup should support your real routine, not add complexity for its own sake. A shop focused on appointment flow may start by keeping booking activity organized; another may prioritize client records or product tracking. Define what information you need to review and how it will support a decision. Then use the same definitions and review periods over time so comparisons remain useful.
Software is one part of effective operations. Staff communication, service standards, and clear day-to-day processes matter too. For practical ideas beyond the numbers, explore this barbershop management tips guide. Together, consistent operating practices and organized records can make it easier to spot questions worth investigating.
If you’re ready to bring booking, client management, sales, and inventory activities into a more organized workflow, take a look at Encore’s barber shop software.
Make Your Next Review a Step Toward Better Decisions
Your next step doesn’t need to be a major overhaul. Choose one operating question you want to answer, decide which figures can help, and note one action to test. A barbershop performance dashboard becomes more useful as that simple habit helps you learn what deserves attention and what can wait. Keep the process grounded in your shop’s goals, and let the evidence guide the next adjustment.
Encore has supported salon and barber shop businesses since 1991, with specialized software for barber shops. If you’re ready to explore management tools that can support your shop’s day-to-day work, take a look at Encore as a practical next step.
Keep asking clear questions, reviewing what changes, and building on what you learn. Your next decision can start with one useful signal.
Frequently Asked Questions
What is a barbershop performance dashboard?
A barbershop performance dashboard is a compact way to keep important business measures visible so you can decide what deserves attention. For example, an owner preparing for a staffing discussion might look at upcoming appointment demand alongside recent completed visits. The dashboard doesn’t explain every change by itself. Its value is helping you identify a useful question, then find the records or context needed to investigate it.
Which KPIs should a barbershop track?
Track the measures that help you manage a current priority. If you’re trying to understand quiet appointment periods, you might review bookings and completed visits for those time slots. If you’re focused on repeat business, consider rebooking or return-visit measures. Define each measure the same way every time, and compare it with your shop’s own history. A figure is more useful when you know what decision it can inform.
How often should a barbershop owner review performance metrics?
Choose a review rhythm you can maintain and match it to the decision at hand. A quick weekly look may help you notice upcoming schedule gaps, while a longer comparison can be more helpful for assessing a gradual change in client visits. Avoid changing the review window from one check-in to the next. Keep a short note of what you observed and what you plan to revisit, so each review builds on the last.
Can barbershop software help track business performance?
Yes. Barbershop software can organize records that support performance reviews, including online bookings, client information, point-of-sale transactions, and inventory activity. Encore offers specialized software for barber shops with these management tools. Use the records to examine specific questions, such as whether a scheduling change coincides with a shift in completed appointments. Software can help organize business information, but you still need context to interpret what a change means.
What should I do if my barbershop metrics suddenly change?
First check that you’re comparing the same type of period and using the same calculation. Then look for a practical explanation in the records. If sales shift, for example, check whether the number of completed appointments or the mix of services also changed. Note what you find and choose a proportionate next step, such as watching the pattern for another review period. One unexpected result is a reason to investigate, not automatically to overhaul your process.
How much does a barbershop performance dashboard cost?
There isn’t one cost that applies to every dashboard or software setup. The amount depends on the solution and the tools your barbershop chooses. Consider which activities you need to manage, what’s included in the option you’re evaluating, and whether it suits your shop’s workflow. Compare pricing information for the options you’re considering with the needs you’ve identified.
Is a performance dashboard useful for a one-chair barbershop?
Yes, if it helps you make a practical decision without creating unnecessary admin. A solo barber might use a small scorecard to understand which appointment periods are hardest to fill or whether clients are booking their next visit. Start with information you already record during daily work. If a measure doesn’t lead to a useful question or action, leave it off. A simple review habit can be more manageable than a complicated tracking system.
Disclaimer
This article is general in nature and may contain errors, please verify all claims with your sales rep